

Double Trouble Strategy for Binary Options Trading
Using a strategy that combines technical indicators as well as a price action style of trading gives you the best of both when it comes to trading. This is what the double trouble +1 strategy is about. All of your technical indicators are actually derived from the actual price. They interpret the prices in a specific way and generally show what has already happened as opposed to predicting what is going to happen.
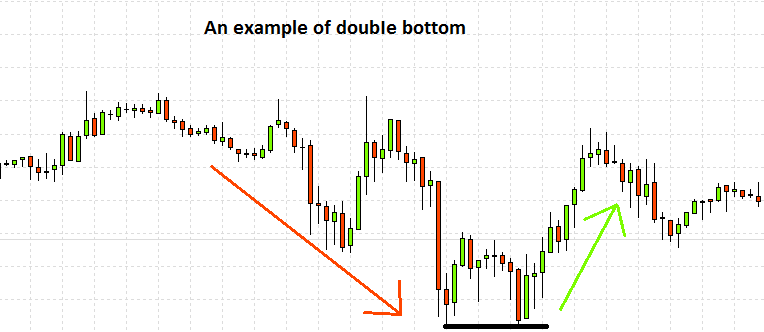
Even though these indicators are often used to try and predict the flow of the market, using some form of price action will generate a better result. Trend lines, chart patterns, S/R levels, channels and even price action can be subjective. Two different traders and look at the same indicators and come out with a different reading and result. To get rid of subjectivity there is a simple chart pattern known as double top/bottom. Price does not move in straight lines and generally had bottoms and tops which create waves which have troughs and peaks. On the double top/bottom, if the price reaches a specific level twice, a pattern develops. Without drawing channels or trend lines, there is very little subjectivity. When your horizontal lines are drawn and connects tops or bottoms you have the double top/bottom patterns.
How do you trade with the pattern?
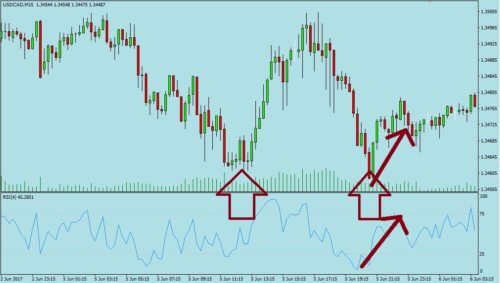
This pattern shows a strong hint of a reversal in the trend as opposed to continuing on the current path. Due to it being a reversal, check the indicator for a pattern. This is the +1 in the strategy and you can use whichever indicator you like. You could look at using a Stochastic set to 6, 9. 15 and enter a trades when the indicator shows overbought or confirms the double top and continues in a downward trend. You could also try using some fast moving averages. The choice is yours as to which indicator you pick.
Pros and Cons of this strategy
With this strategy, you will have to trade countering the trend every time as opposed to the trend. The double top/bottom is a reversal pattern in opposition to the current trend. There are also not that many signals when using this strategy on a daily basis. This strategy is however very simple and adaptable and you can choose the indicator yourself, preferably one you are comfortable with. This chart is very simple and easy to use, and the pattern is easy to identify. You just check for the price to stop at the same place twice and then confirm your suspicions via your chosen indicator. This strategy is suitable for beginners but expert traders are more likely to do well when using this method to trade.
 )
)